Vrinda Store
Annual Dashboard 2022
This project is a personal project to practice my critical thinking and communicate reports in dynamic dashboard.
Problem Statement
The sales manager at Vrinda Store saw the sales figures continue to decline until the end of the year, he was confused about what happened to his sales. He wants to analyze what happened to sales in 2022 and wants to immediately come up with a solution so that the problem can be solved and make a new plan to increase sales next year.
Objective
Vrinda store wants to create an annual sales report for 2022. So that, Vrinda can understand their customers and grow more sales in 2023.
Business questions
The goal of this project is to answer the following questions such as:
→ Compare the sales and orders using single chart?
→ Which month got the highest sales and orders?
→ Who purchased more? men or women in 2022?
→ What are different order status in 2022?
→ List top 10 states contributing to the sales?
→ Relation between age and gender based on number of orders?
→ Which channel is contributing to maximum sales?
→ Highest selling category?
Insight
After conducting an in-depth analysis of Vrinda Store sales data for 2022, we get a number of interesting insights:
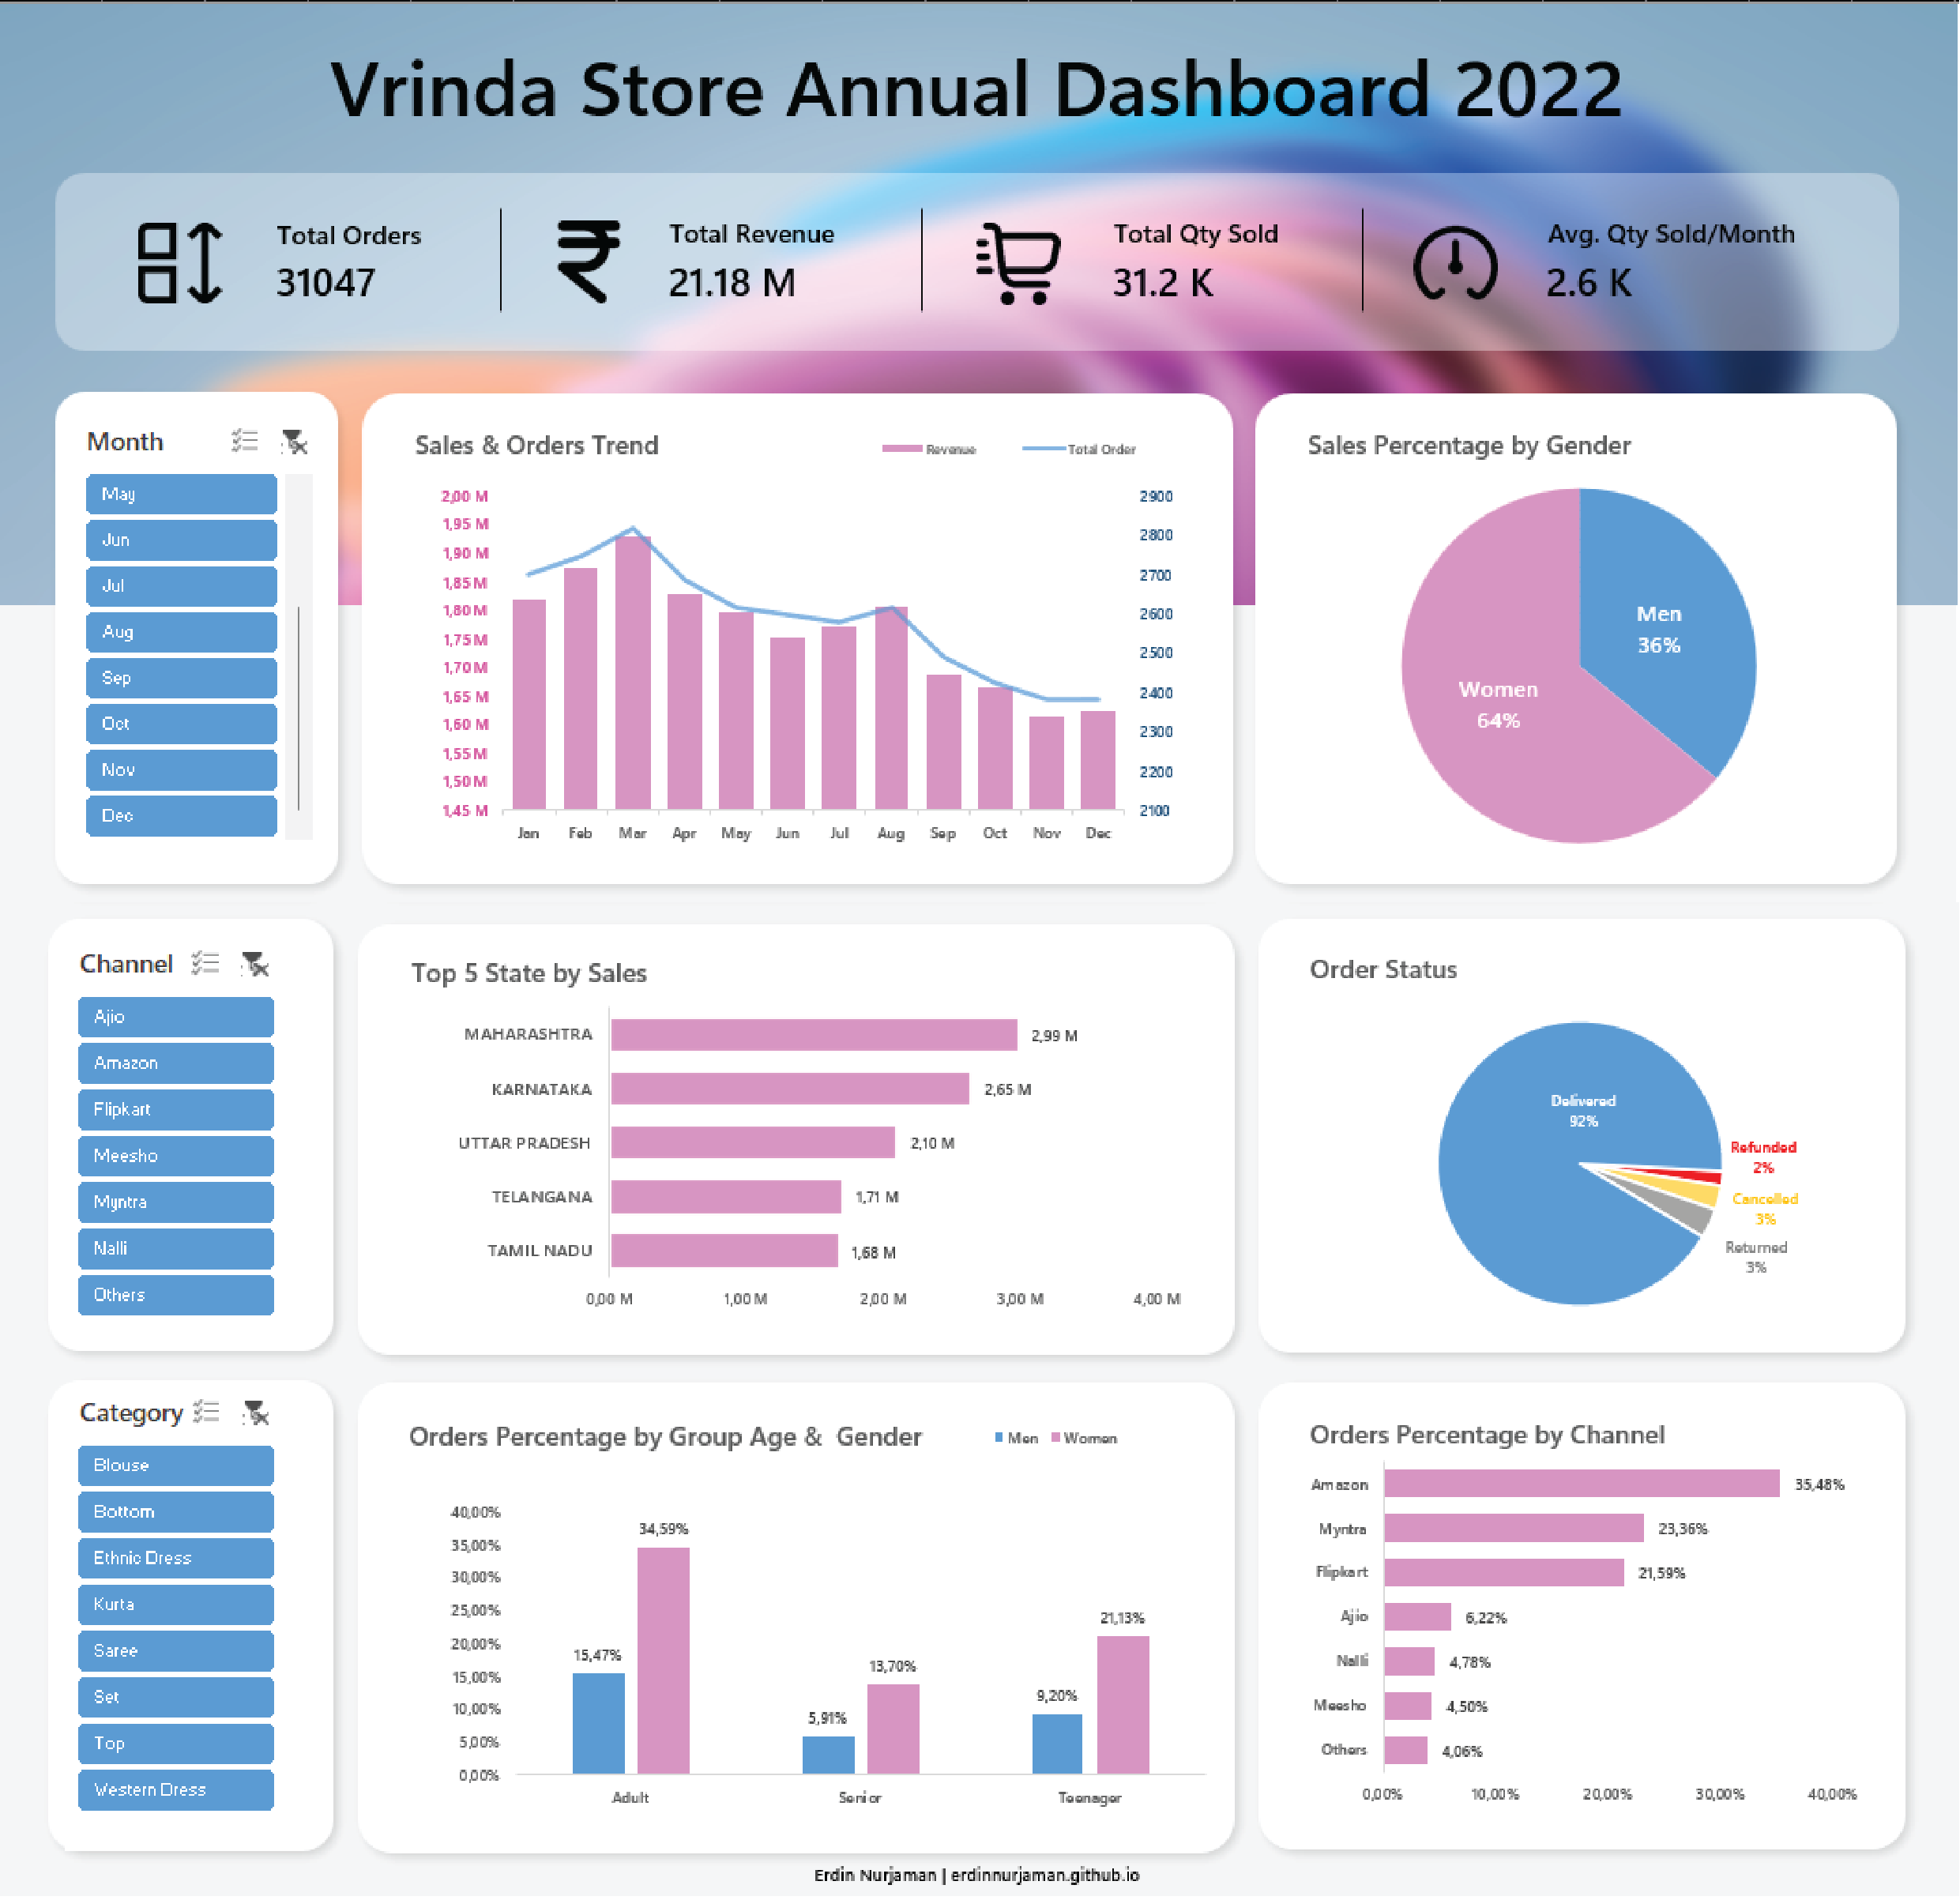
→ Overall, throughout 2022 Vrinda Store sales have decreased.
→ Reached sales peak in March, but until the end of the year sales decreased by around -15.88%.
→ Buyers are dominated by women with a percentage of 64% of the total.
→ Maharastra, Karnataka and Uttar Pradesh are the top 3 cities by the number of sales.
→ The percentage of delivery success reaches 92% of the total.
→ Half of the total buyers are those with an age range between 30-49 years.
→ Amazon is the most used purchasing platform with a percentage of 35.48%.
Recommendation
→ Targeting women customer aged between 30 - 49 years living in Maharastra, Karnataka and Uttar Pradesh by displaying advertisements, attractive offers or purchase discount coupons on Amazon, Myntra and Flipkart platforms.
Click this image below or click this link for complete interactive excel dashboard.
